Maximize Your Marketing ROI with Galileo Multitouch Attribution for SugarCRM
Transform Your Marketing with Proven Excellence: Elevate your marketing analytics with Galileo by Arcalea, a Fortune Magazine recognized leader in marketing technology, and the preferred platform for one of the largest SugarCRM integrators in the world. Our state-of-the-art, cookieless, first-party data attribution platform seamlessly integrates with SugarCRM to deliver unparalleled insights into every step of the customer journey.
- Strategic Investment: Directly link your marketing initiatives to revenue outcomes, enabling precise investment in high-performing channels for maximum ROI.
- Cost Efficiency: Dramatically reduce acquisition costs by eliminating spend on underperforming marketing tactics, based on reliable, data-driven insights.
- Advanced Attribution: Utilize our sophisticated multitouch attribution model to understand the impact of each customer interaction across all channels, far beyond the capabilities of traditional analytics.
Seamless SugarCRM Integration: Galileo enhances SugarCRM by enriching customer profiles with deep behavioral insights, empowering your sales team to close deals more effectively and build stronger customer relationships.
Why Galileo Stands Apart
Chosen by industry leaders and globally recognized by Fortune Magazine as one 2024's most innovative companies, Galileo offers:
- Comprehensive Customer Journey Tracking: From the first point of contact to post-purchase activities, our platform tracks and analyzes every interaction in a privacy-first, cookieless environment.
- Real-Time, Actionable Insights: Make informed decisions swiftly with real-time data that adapts to dynamic market conditions and customer behaviors.
- Limitless Historical Data Access: Explore unrestricted historical data to identify enduring trends and optimize your future marketing strategies.
- Detailed Analytics: Dive deep into your marketing data with high granularity to understand nuances and extract valuable insights that drive strategic decisions.
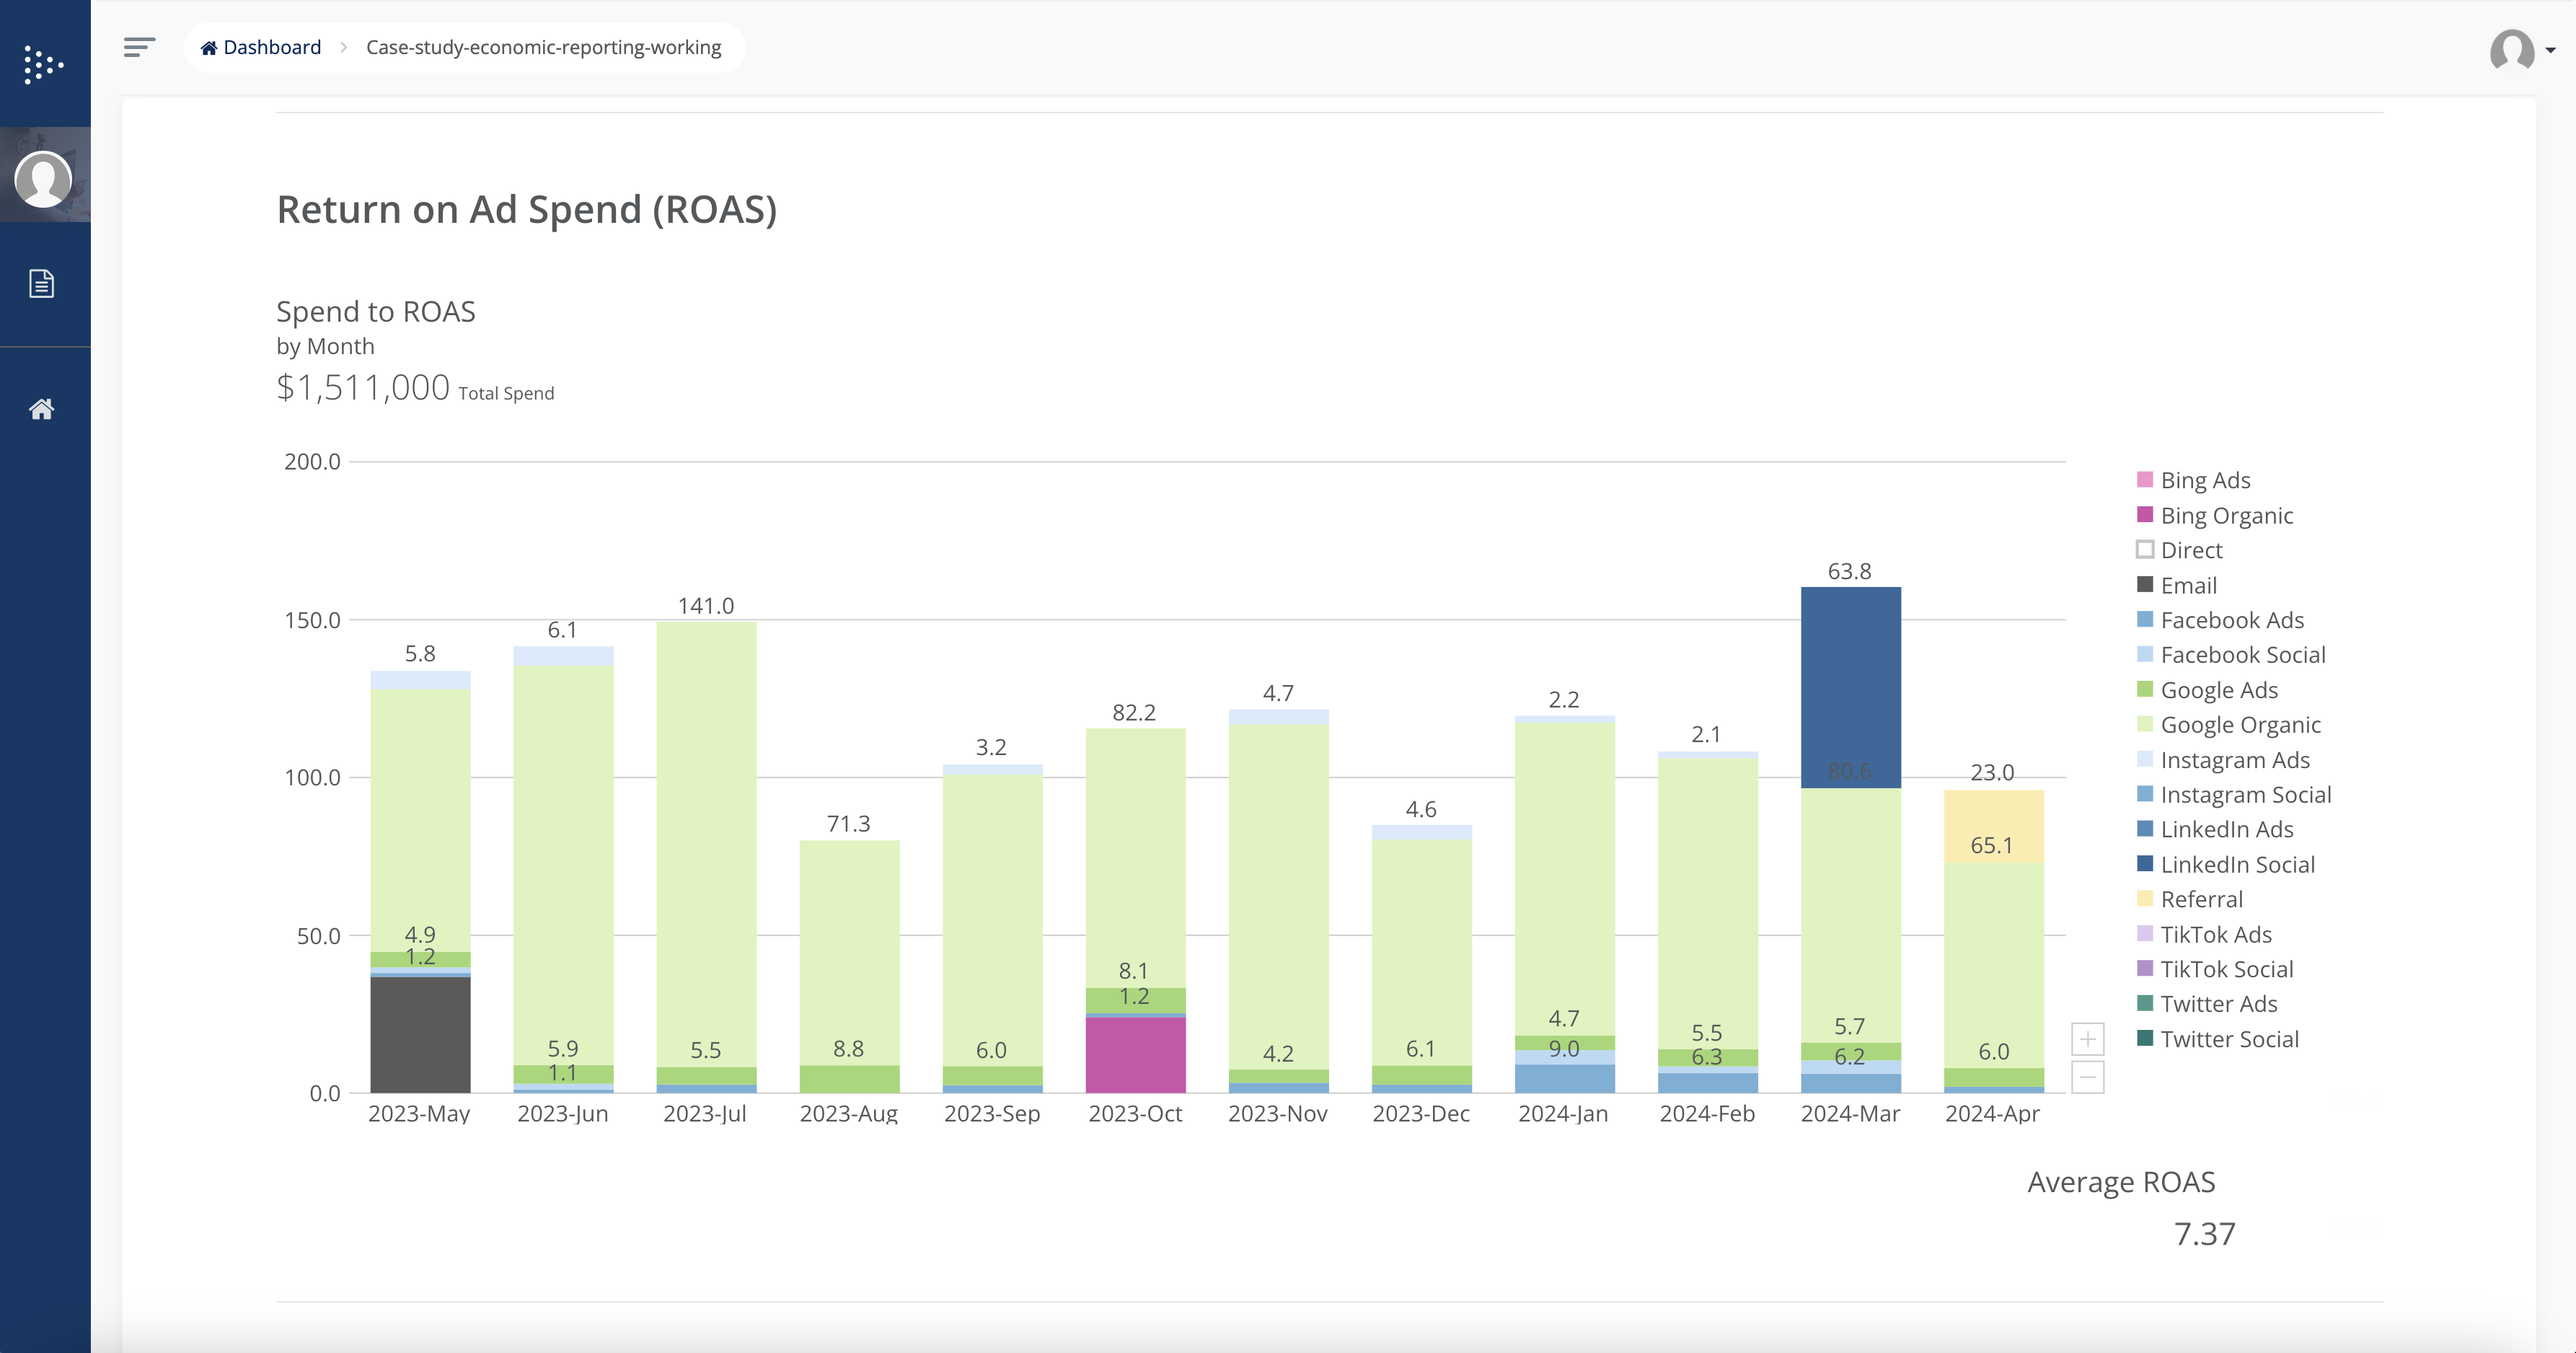
- Economic Reporting: Gain a clear understanding of your marketing investments with detailed economic reports including Customer Acquisition Cost (CAC) and Return on Ad Spend (ROAS).
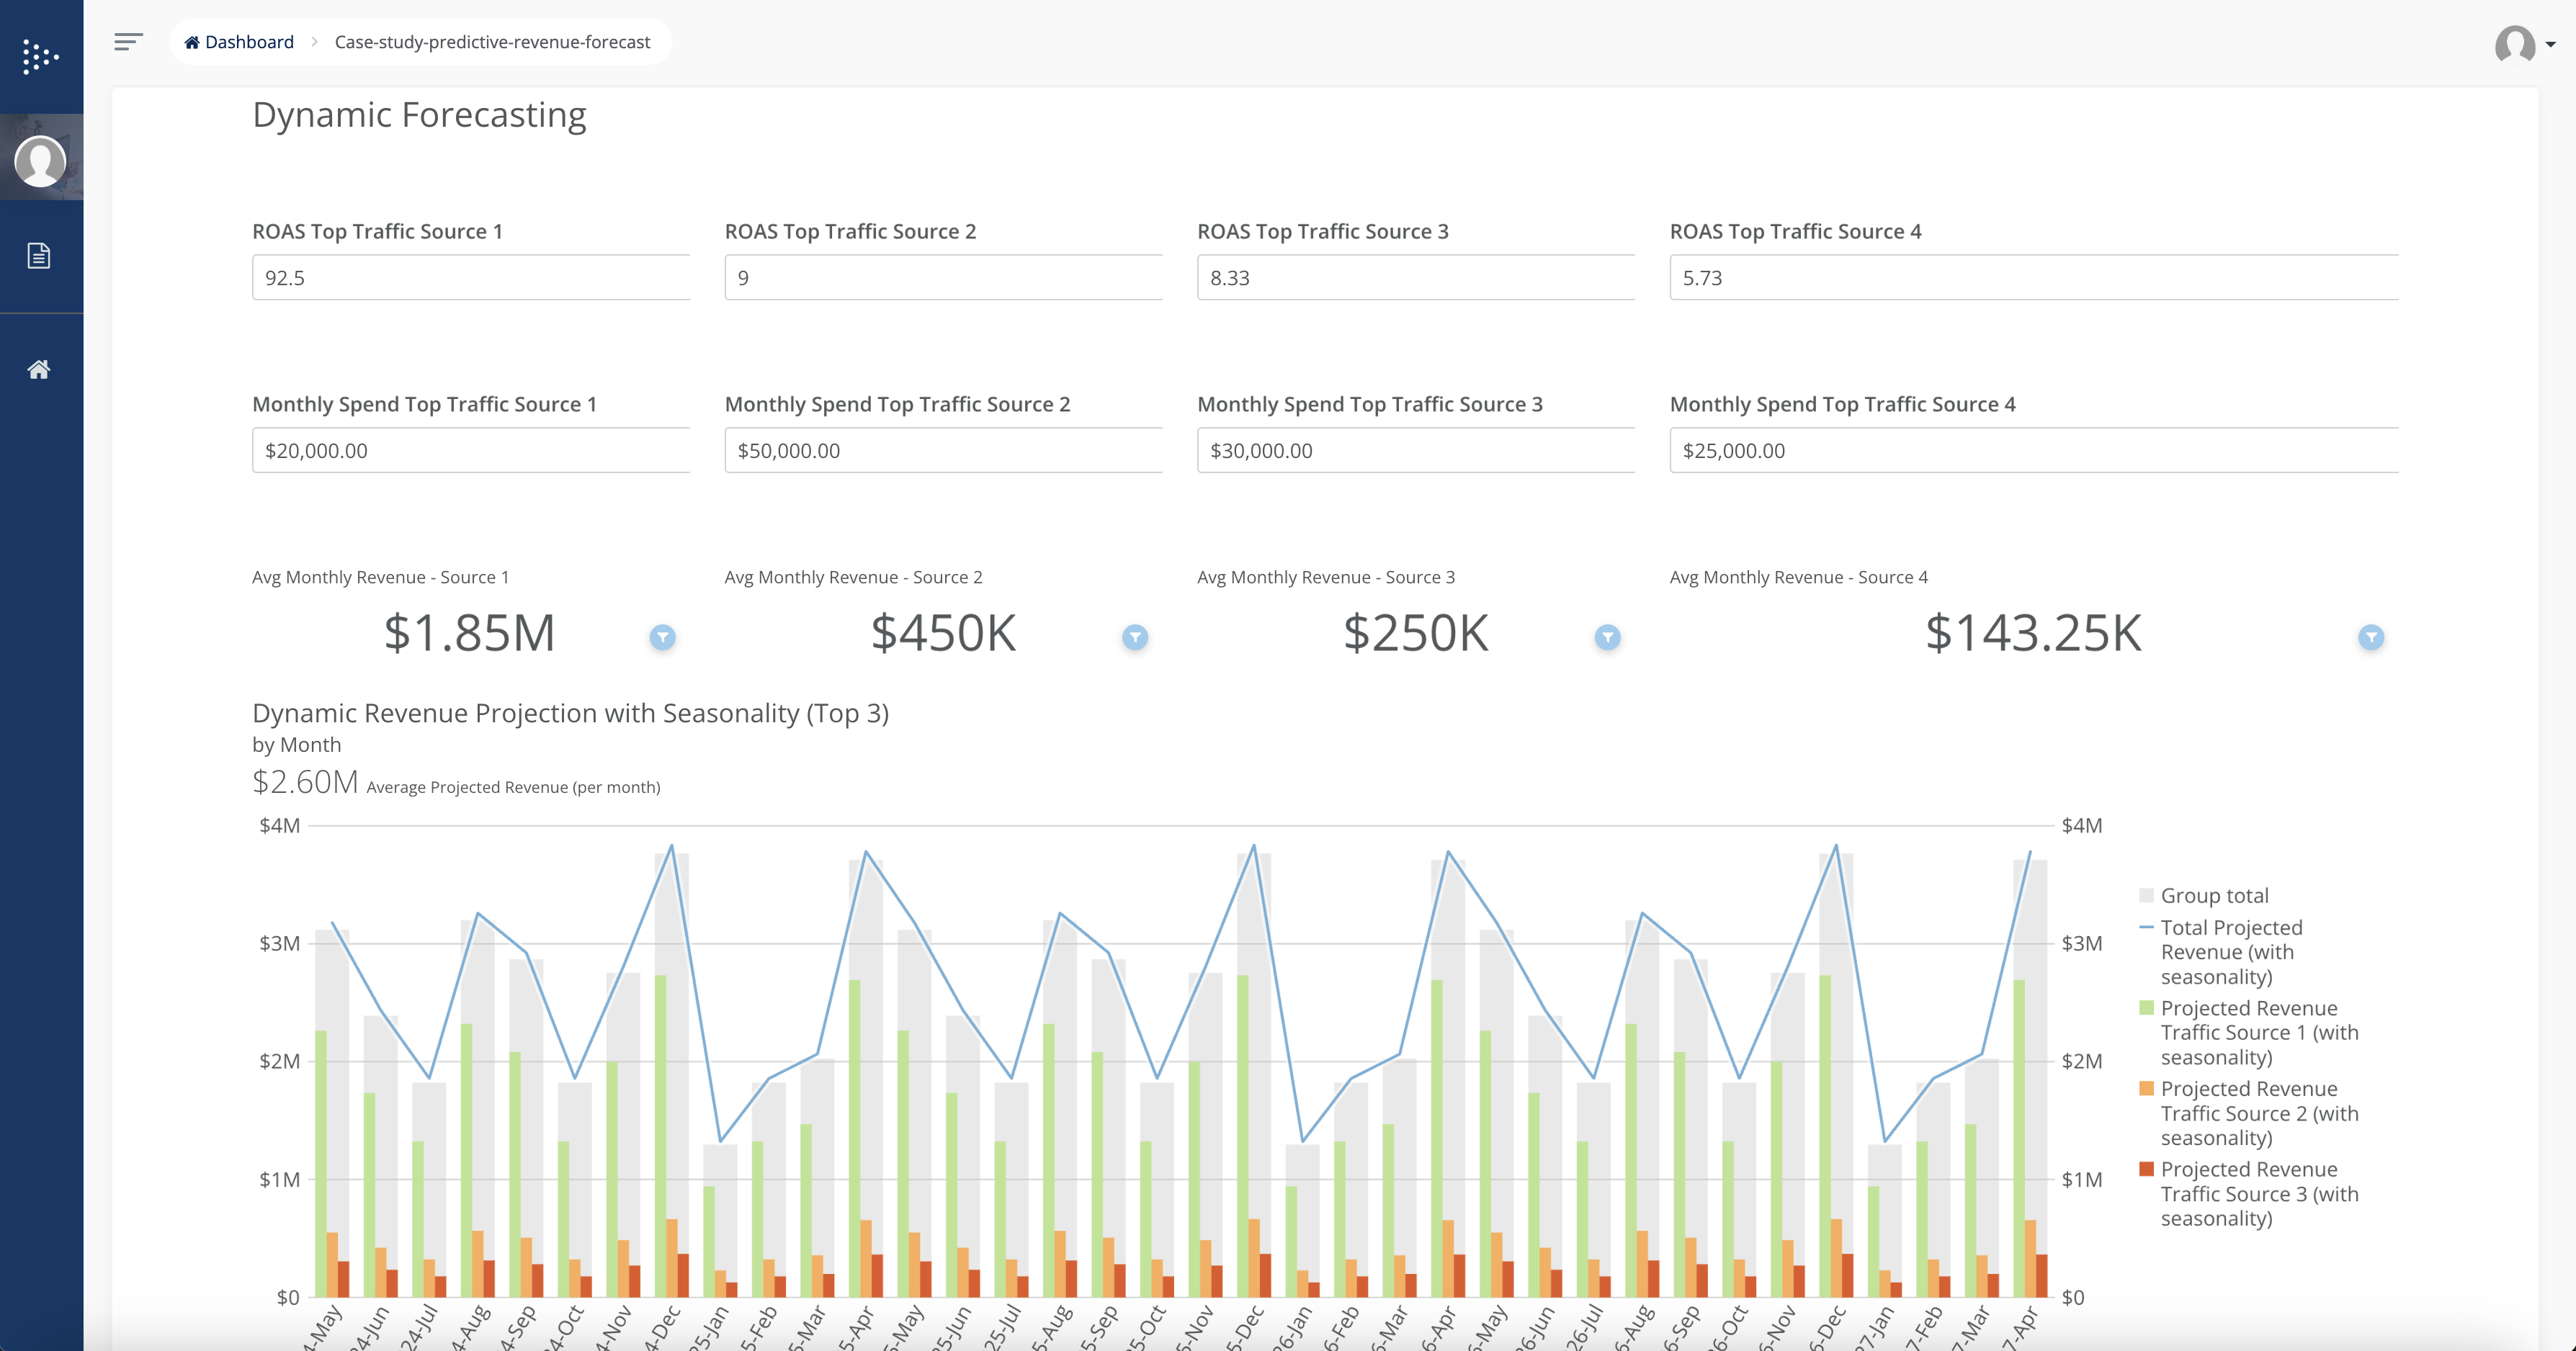
- Predictive Revenue Modeling: Leverage data-driven attribution (DDA) to forecast future revenue and model economic outcomes based on your current marketing strategies.
Join Leading Companies: Follow the footsteps of top firms that rely on Galileo to steer their marketing strategies. Discover why we are the platform of choice for one of the largest SugarCRM integrators globally, trusted for delivering measurable improvements in marketing efficiency and effectiveness.
Ready to revolutionize your marketing outcomes? Visit our website to learn more about Galileo for SugarCRM and start making smarter marketing decisions today.
Galileo Pricing and Features Overview
All Tiers (Starter, Business, Professional)
- All Web Traffic Tracking: Tracks and captures all web traffic, including organic, paid, social, and other channels.
- Galileo Visualization Dashboards: Users access dashboards to analyze marketing and sales performance, identify high-return opportunities, and maximize efficiency and revenue.
- Traffic Analytics: Detailed analysis isolating performance factors that enhance ROI.
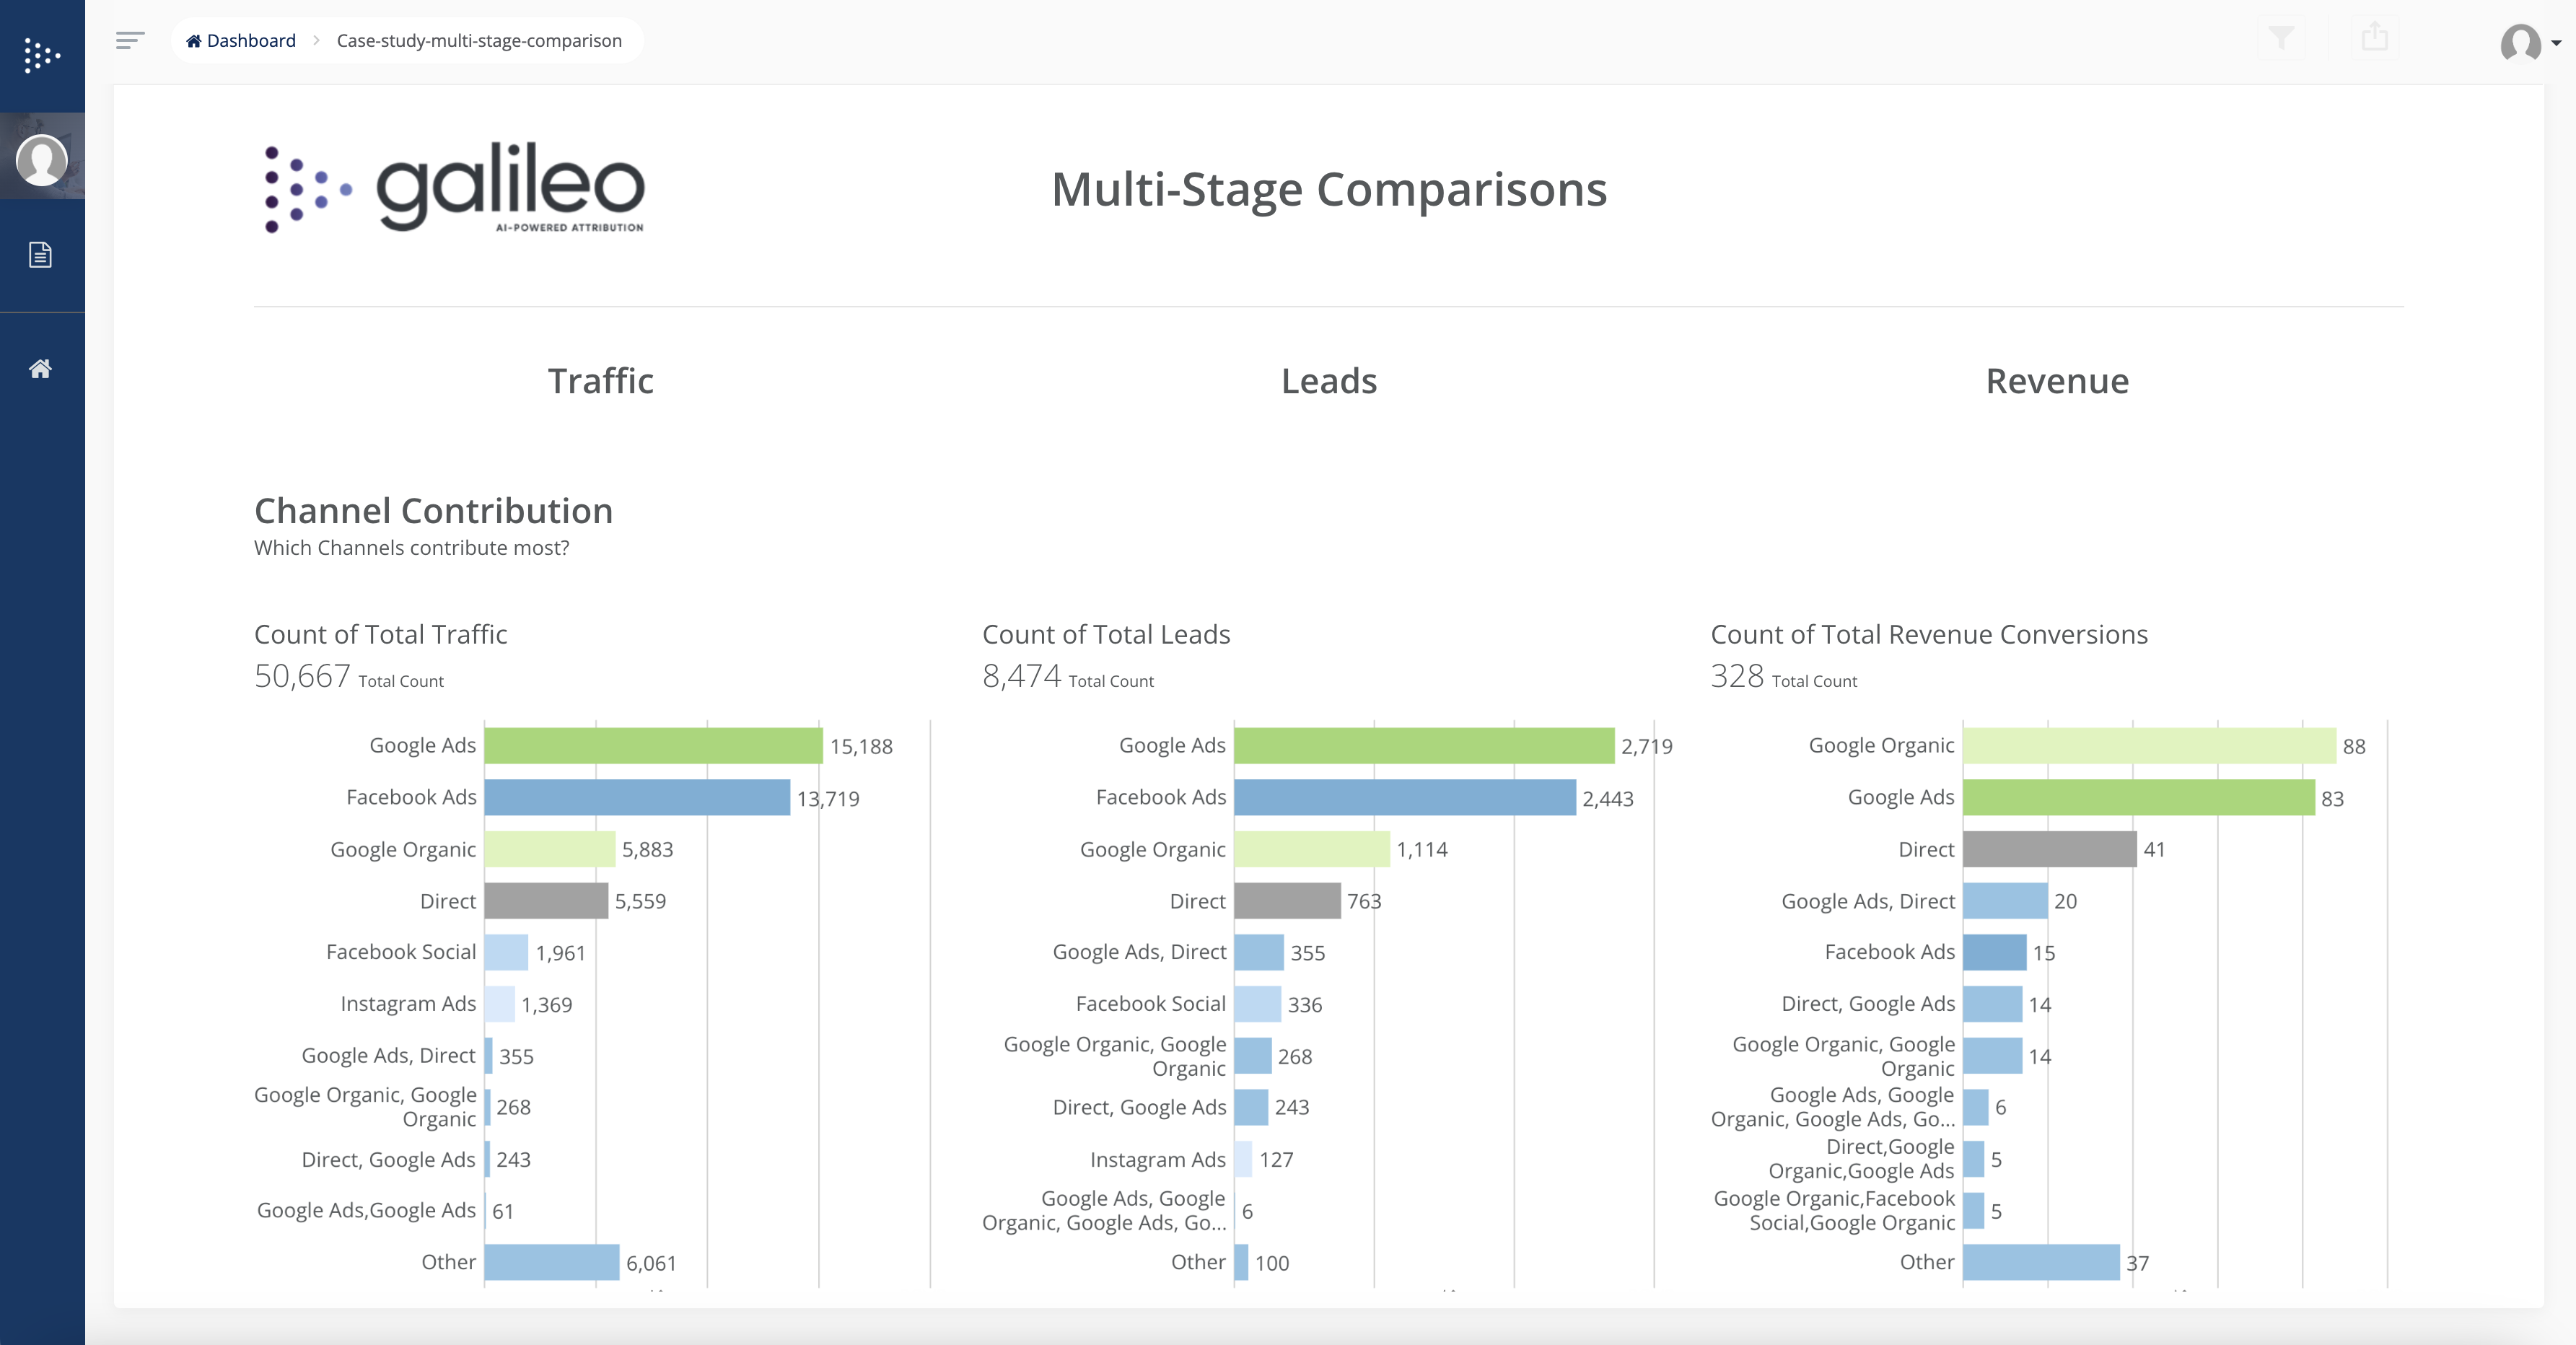
- Channel Contribution: Measurement of each channel’s ability to deliver traffic, leads, or customers.
- Paid Keywords Identification: Identification of keywords driving traffic through paid media and SEO.
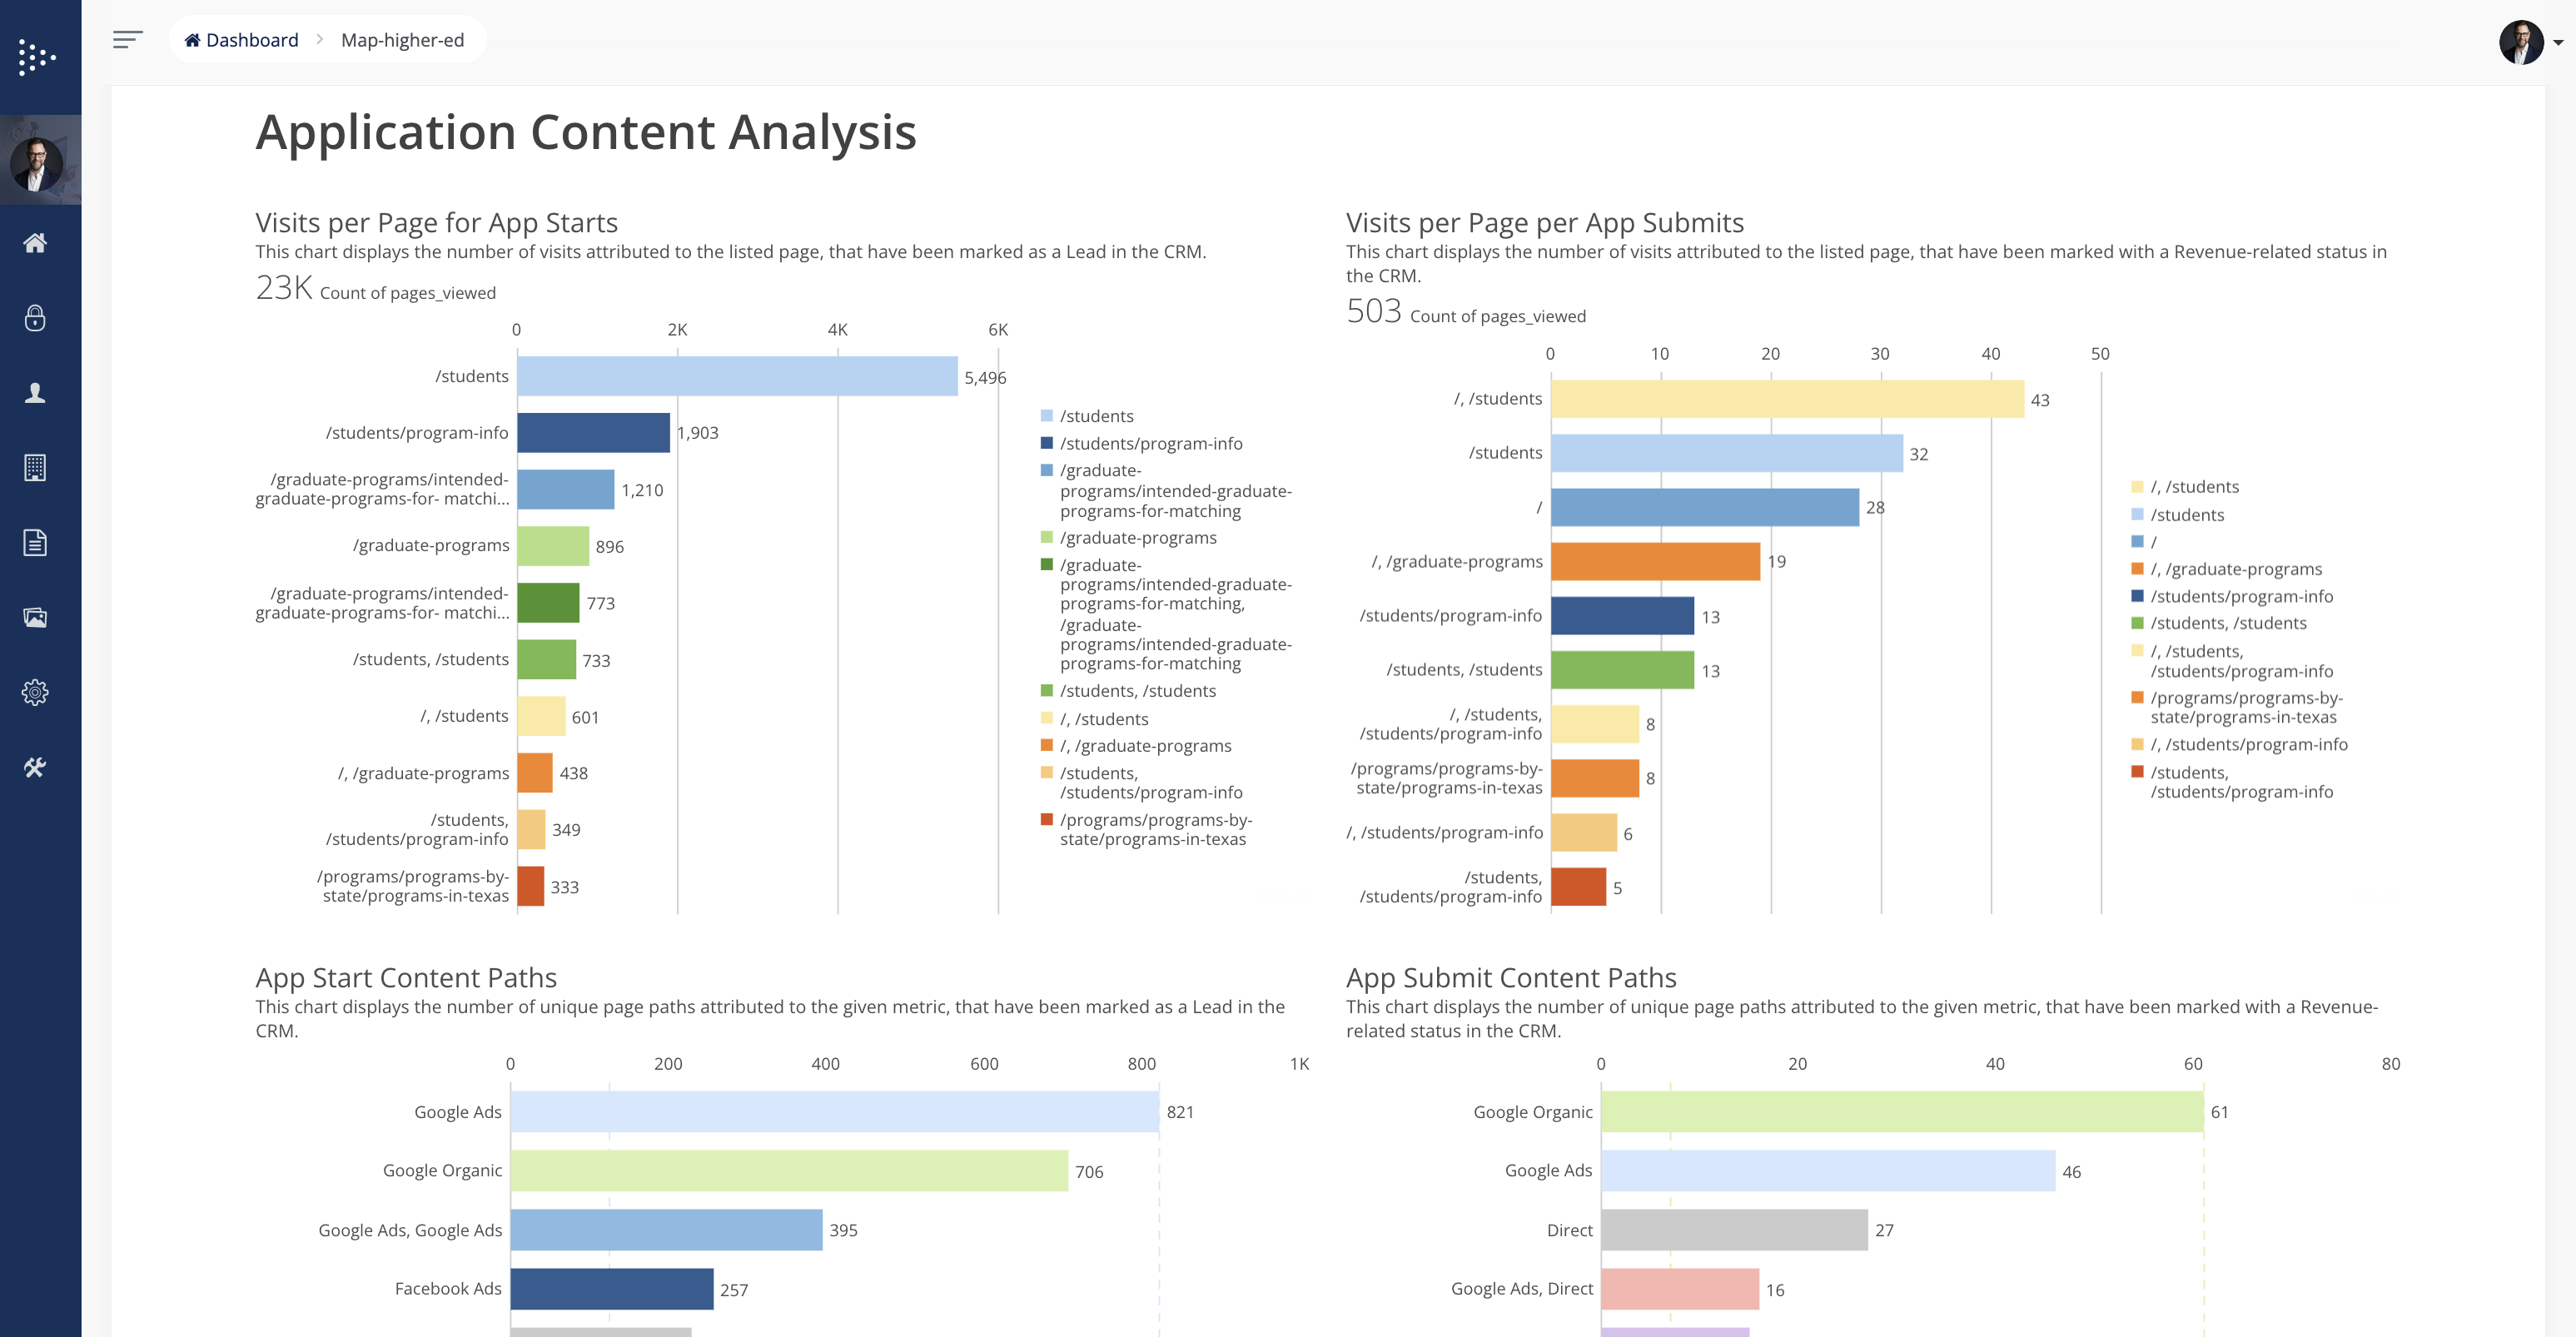
- Web Page Contribution: Assessment of specific web pages' impact on revenue generation.
- Unique Page Paths: Calculation of unique page paths for conversions and revenue contribution.
- Performance by Campaign: Impact of each marketing campaign on revenue performance.
- Geographic Distribution: Tracking of prospect and customer locations to pinpoint regions contributing most to conversions and revenue.
- Dedicated Partner Manager: Each client receives a dedicated manager for consistent communication and service delivery.
- Galileo University - Galileo GPT: Access to training and best practices for maximizing the use of Galileo.
Business and Professional Tiers
- Economic Analytics: Analyzes economic efficiency of marketing efforts based on revenue-related KPIs.
- Total Leads by Channel: Calculation of total leads generated by each channel.
- Total Revenue Conversions by Channel: Calculation of revenue conversions per channel.
- Customer Acquisition Costs (CAC) by Channel: Calculation of CAC per channel.
- Return on Ad Spend (ROAS) by Channel: Calculation of revenue earned per dollar spent on advertising.
- Site Traffic, Leads, Revenue Attribution: Breakdown of visitor journeys by traffic source, leads, and revenue generation.
- Primary CRM Integration: Integration with the business's primary CRM for revenue attribution calculations.
Professional Only
- Economic Forecasting: Predictive economic forecasting based on model analyses.
- Data Driven Attribution: Uses advanced machine learning for accurate allocation of conversion credits across marketing touchpoints.
- Dynamic Revenue Modeling: Enables testing of different spend scenarios and their impact on revenue outcomes.


.png)

.png)
.png)


Requirements & Notes
Compatible with Sugar 12 and above.


